![]()
|
STA
6166 UNIT 4 Section 1 Answers
|
| Welcome | < | Begin | < | < | Unit 4 Section 1 Answers | |||||
| To Ag and Env. Answers |
| To Tox and Health Answers |
| To Social and Education Answers |
| To Engineering Answers |
1. What is the analysis objective in regression?
To use data on a quantitative independent variable to predict or explain variation in a quantitative dependent variable.
2. What are the steps in performing a regression analysis?
3. Write out the functional form for a linear regression model?
where y is the response or dependent variable, x is the predictor or independent variable, b0 and b1 are the unknown intercept and slope parameters and e is the random error in prediction (or residual) that is assumed to follow a Normal distribution with mean zero and common standard deviation se.
4. What is the difference between a proportional relationship and a linear relationship?
A proportional relationship IS a linear relationship, it just has one more constraint than does a linear regression relationship. In a proportional relationship, the relationship line must pass through the (x,y) point of (0,0) whereas for a linear regression relationship, the line is not constrained to pass through the origin but is assumed to pass though some value b0 . In a proportional relationship, the ratio of y to x is assumed constant. That is y = ax or y/x = a. In a regression relationship y-b0 /x = b1.
5. The error term in a linear regression model symbolically represents two types of errors, what are they?
Random errors in measurement and/or inadequacies in the model form.
6. How would you decide what form the relationship among your variables should take? What are least squares parameter estimates?
We determine the form of the relationship using two possible approaches. First, the theory underlying the process under study may suggest a form. A subset of this is that current thinking and/or publications suggest a form. The second approach is to look at appropriate scatter plots of the data and allow it to suggest possible forms. In the first case, the regression can be looked at as a type of validation of theory, in the second, the regression is a way of exploring for relationships.
The least squares parameter estimates are those values of the model parameters that produce the smallest value for the sums of squared residuals.
7. When we talk about partitioning sums of square, what are we talking about?
Essentially, the sums of squares that is being partitioned is that associated with the variability in the response, that is (nT-1)Var(Y). These sums of squares are split into a component that is associated with the variation in the treatment group means and that associated with a variability estimated created by pooling components of variation within each group. Under the null hypothesis of equal group means, both the estimate of variability among group means and the estimate of pooled within group variation should measure the same variability term, hence the ratio of these terms should be close to one.
8. What are the two assumptions we make regarding model errors which allow us to perform inferences on model parameters and predictions?
The first is that the error terms are independent of each other. The other is that the error terms are normally distributed with common variance. The first assures that the sums of square are good unbiased estimates of the underlying variance components. The second provides us access to the Central Limit Theorem and essentially allows us to perform the statistical tests. Violation of either assumption results in invalidation of the statistical tests, although violation of the common variance assumption will typically cause the most problems.
9. When we test for a significant regression, we compare two competing models, what are they?
The first model is the regression model that is the objective of the analysis. It represents the alternative hypothesis since if directly speaks to our analysis goals. This model tells us that the mean or expected value of the response depends on which value of the predictor one is talking about. The second model addresses the null hypothesis. Under the null hypothesis there is no relationship between the response and the predictor, hence the model does not have the predictor in it. We call this model the null model or the overall mean, since the expected value of the response only depends on its mean and not on the predictor.
10. Plot a configuration of residuals which would indicate an inadequate regression.
As an extreme case, consider the following. Note the systematic nature of the residual patterns as a function of the predicted ("fitted") responses.
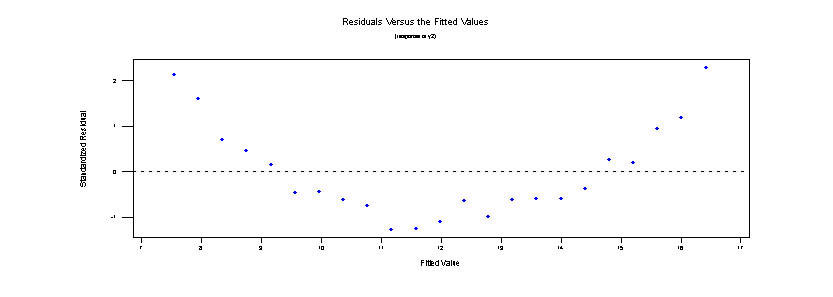
Of course the graph could be even more patterned.
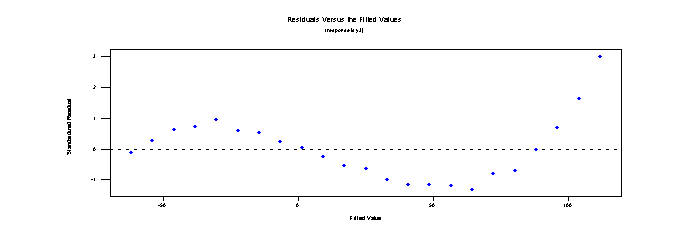
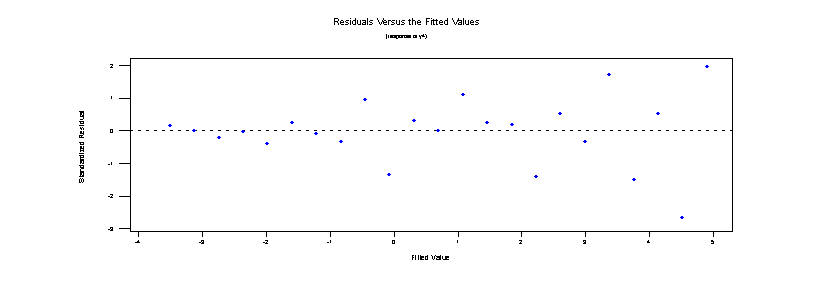
Finally, we could have a problem with heterogeneity of variances. Notice how the spread of the residuals are small for low values of the predicted response but gets much larger as the fitted value gets larger. This is a serious violation of the assumptions underlying the regression.
11. If I found a standardized residual which had value -4.1, what might I conclude?
A residual this large would represent an influential observation. First I would check if the response value I recored in the data set is truly the value observed or whether there was a recording error. Next I might examine the effect on the regression line of removing the observation from the regression. If the regression line changed significantly then I might conclude that this observation represents some event or process that is not acting or present in the other observations. I would attempt to figure out why this is so. But, I would probably also not include it in the regression and report the final line estimated without it in the dataset. I would talk about the point in my discussion and make clear to the reader the reasons for removing if from the final analysis.
12. What characteristic must my data have if I am to attempt to compute a pure error term?
To compute pure error, one needs measurements of multiple value of the response for the same value of the predictor. Pure error is similar to the mean square error term from an analysis of variance, that is, it measures the pooled within group variability. Without some replication (multiple y's) for some values of the predictor (x), this term cannot be measured.
13. What does r measure?
The term "r" typically refers to the simple Pearson Product Moment Correlation. It is a measure of the degree of "linear" association between two variables.
14. What does r2 measure?
The term "r2 " refers to the square of the Pearson Product Moment Correlation. When used in simple linear regression, it measures the proportion of total variability in the response that is "explained" by the regression of y on x. Note that when we have multiple regression, the lower case r is replaced with an upper case R2 term but it still is interpreted as the fraction of total variability of the response, y, that is explained by its regression on the predictor set, x1, x2, x3, ...
15. State the formal assumptions of regression analysis.
16. In the prediction equation, ![]() ,
what are the
,
what are the ![]() terms.
terms.
These are the least squares ESTIMATED values of the intercept and slope terms respectively.